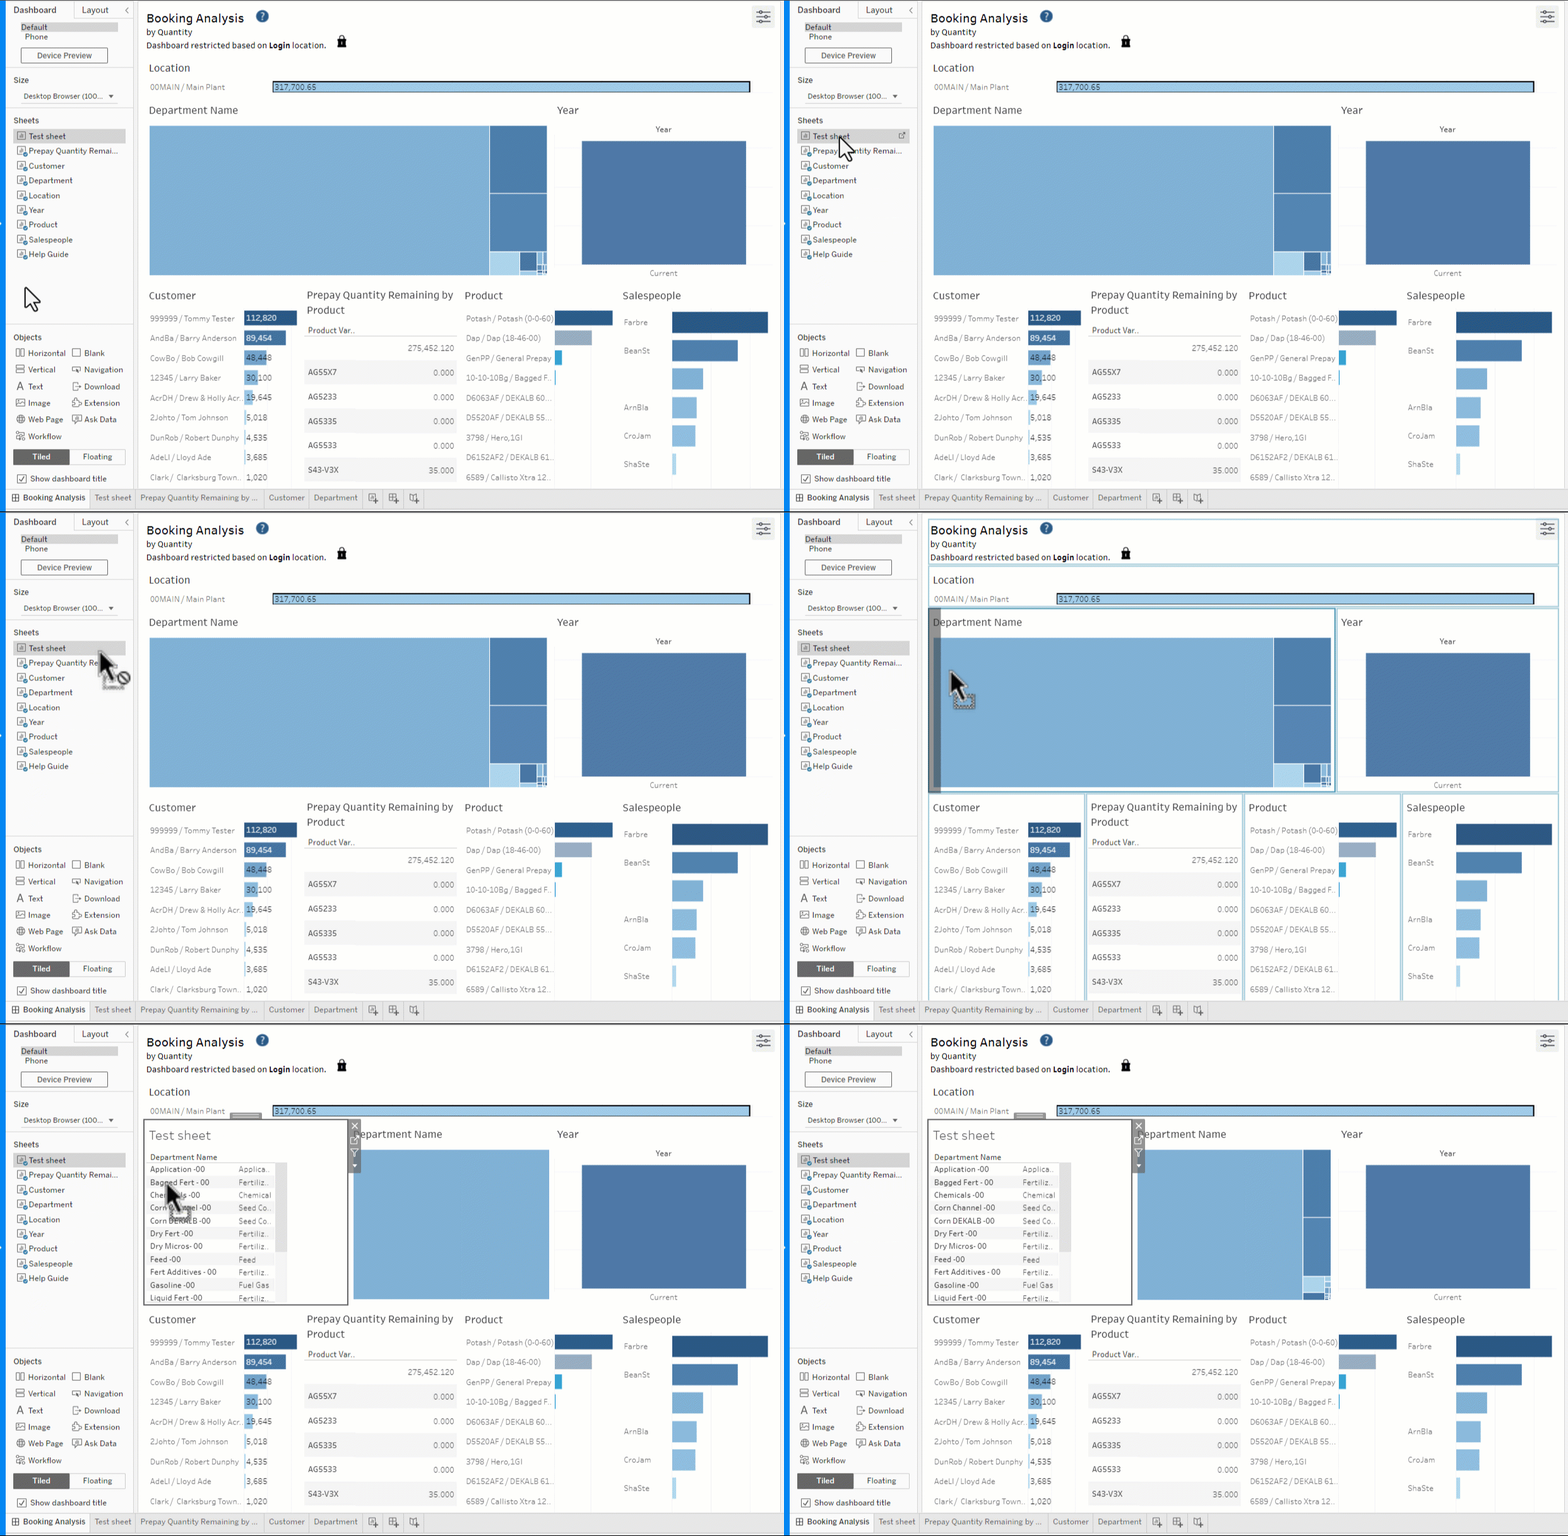
Those designated as Analytics Authors have the ability to add a visualization to standard and Company Content dashboards in SKY Analytics.
To add a visualization to a dashboard, navigate to that dashboard and select Edit Dashboard in the lower right.
- Select Worksheet in the top toolbar and then choose New Worksheet. A blank worksheet loads on-screen and a corresponding new worksheet tab is added along the bottom.
- At the bottom of the screen, right-click on the the new worksheet tab and select Rename.
- Enter a Name for the worksheet and choose OK.
- Create a visualization by dragging data elements to the worksheet.

- Once data elements have been added and formatting is complete, return to the main workbook by selecting the tab at the bottom.

- Locate the new worksheet in the Sheets section on the left. Click to highlight the new worksheet and drag & drop in the desired location of the workbook.

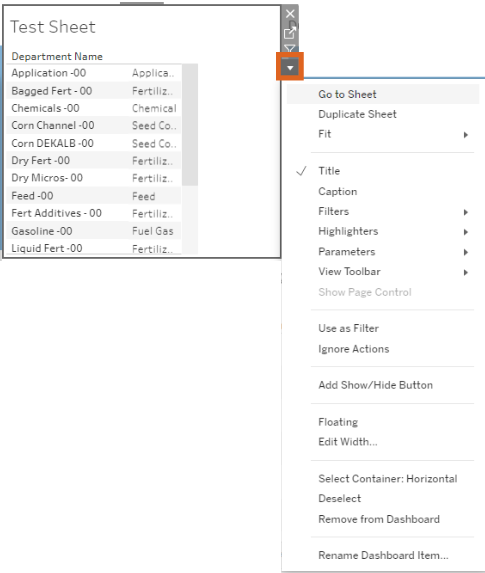
- Optionally, format the worksheet by selecting More Options.

- When complete, select Publish As.
- On the Publish Workbook window, enter a Name then choose Company Content. This makes the dashboard available to those with access to the Company Content area in Analytics.
- Optionally check Show sheets as tabs and/or Embed password for data source.
- Choose Publish.


