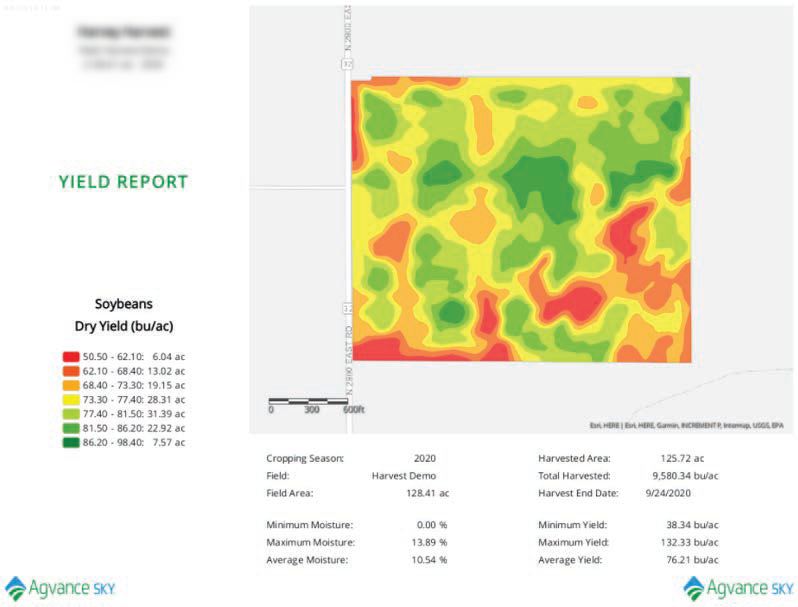
The SKY Yield Map report displays the harvested yield monitor data and field stats to create a visualization of data collected throughout the harvesting season.
- Navigate to Reports and select the SKY Yield Map report. Choose the appropriate season from the Season drop-down under Options.
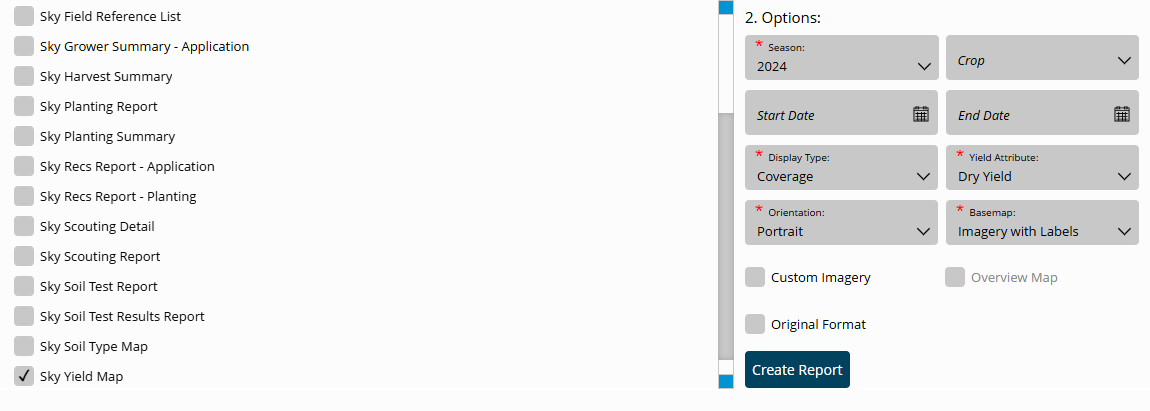
- Select the desired Basemap imagery from the Basemap drop-down. Optionally select the following report criteria:
- Crop – Select to run the report for only the Crop selected on the chosen Field(s).
- Start / End Date – Choose to include only Recs within the selected date range.
- Custom Imagery – Select if custom drone imagery has been imported for the chosen Field.
- Overview Map – Select to add a boundary overview of the field to the report.
- Select the desired Field(s).
Note: Multiple Fields and Events can be selected. If selecting multiple Events, the Events will display per Field on the report. - Once all desired report criteria are selected, choose Create Report.
Note: If no Recs are available per the report criteria selected, a warning message displays and the report fails to run. - The report displays in the Reports Based on Field Selection grid with a Status of In Progress. Choose View Report to open the report.
- The report prints in Polygon format with statistics based on filters set up on the selected Event(s).