Scroll through or select from the TOC to jump to specific areas.
SKY Mapping Videos
Mapping Menu
The Mapping menu allows the options to navigate, search, and take measurements in the mapping area.
Map Extent
Select Extent to navigate the Mapping window.
- Previous – This moves to the map boundary last viewed. If the map was not previously zoomed to a different Field boundary, this will navigate to the area of the map last viewed.
- Next – This moves to the next Field boundary.
- Full – This displays the full extent of the map. All Fields added to the Customer list will be shown.
Measure Tool
Select Measure to measure any distance in the Mapping area.
- Area – Measure by acre, square feet, or square yard.
- Line – Measure by feet, inch, or yard.
- Lat/Lon – Change the Coordinate Format to DD or DMS.
Search
Select Search to zoom to any location on the map.
- City/Zip – Enter any city or zip code and choose the Search icon.
- Lat/Lon – Enter a specific Latitude and Longitude.
- PLSS – Enter a State, Township, Range, and Section to zoom to that location.
- Non-Field – Select in this field to search based on Non-Field features. Choose from the drop-down that displays.
- Event ID – Select in this field to search based on Event IDs. Choose from the drop-down menu.
Action Menu
Add data to Mapping Premium using the Action and Mapping menus. The Action menu allows the option to navigate and create data elements for each Field.
Fields
- Select Fields to access all Fields available to view.
- Choose the customer name to expand the list of Fields for that customer.
- Select a Field name to choose the Field which is indicated by a darker gray color and a green bar to the left of the name.
- Select either a Field or multiple Fields at a time. A number displays next to the customer name indicating the number of Fields currently selected.
Action
Each level in the list has a Vertical Ellipsis icon to open the View and Edit menu options available.
Recs
After selecting a customer and Field(s), choose Recs to calculate recommendations for Application and/or Planting.
Note: Designate Application Zones and, when opening a Blend Ticket in Dispatch or Apply, the Application Zones are automatically included on the Work Order and available to dispatchers, sales staff, and applicators. When specifying a partial area of a field to be treated, applicators can confirm the correct acres and area of the field.
Events
- Select Events to create data events.
- Choose an input option: Application, Harvest, Irrigation, Planting, Sampling - Soil, Sampling - Tissue, Scouting, or Tillage.
Note: Scouts can select multiple conditions, enter observations, and collect data by point, tracking, freehand zones, or whole field. Pressure ratings can be recorded and photos captured for each observation. Print or email completed reports directly to the grower.
Layers
- Choose Layers to display each Event or Recommendation layer created for the selected Field.
- Select the layer in the list to view any layer in the Mapping screen.
Import Boundaries and Data
- Select Import to import boundaries, monitor data, or soil-sampling data to a Field(s). Choose Upload Files.
- Select the Data Type and Format Type from the drop-down menus.
- Browse to select a file or drag and drop the file in the designated area and select Upload.
Hide/Show
Select the Hide/Show icon to hide the menu to view the Mapping window in an extended view.
Creating Import Templates
Add data to Mapping Premium by creating import templates.
- Select Template Manager from the Setup menu.
- Choose the + icon to add a new template.
- Select a File Type from the drop-down menu.
- Choose Select File, navigate to the file location, and select Open.
- Enter a Template Name.
- The table displays all rows associated with the file. Use the drop-down arrows to match the Grower, Farm, and Field values.
- Choose Save. An error message displays if required fields are not completed.
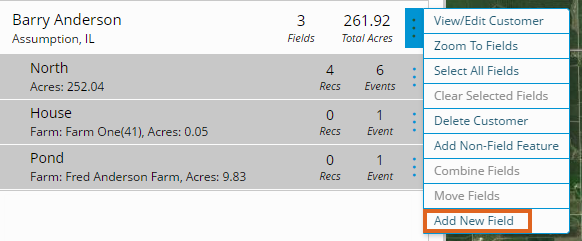
Adding New Fields
When adding a new field to SKY Mapping, the field and farm may be added in the Agvance Hub first and selected from a populated drop-down list or added from SKY Mapping as the field is being drawn.
- Navigate to the desired customer and select the Vertical Ellipsis icon to the right of the Customer Name.
- Select Add New Field.
- If the Field/Farm names have been previously set up in the Agvance Hub:
- On the General Information tab, choose Farm Name from the drop-down.
- The Field Name drop-down populates, allowing the Field to be chosen from the list.
- If the Field/Farm names have not been previously set up in the Agvance Hub:
- Create a new Field in Agvance SKY by manually entering the Field/Farm name. A new Field will automatically be created and will also display in the Agvance Hub.
- Fill in any additional information to be stored for the new Field. The information entered here is for reference only.
- If the Field/Farm names have been previously set up in the Agvance Hub:
- Select Import to import a shapefile of the boundary or choose the Draw icon to view available drawing tools and to create a Field boundary.
- Select either the Polygon or Circle tool to draw a Field boundary.
- The Field displays the total number of acres within the new boundary.
- Choose Save. An error message displays if required fields are not completed.

Importing Field Boundaries
- Select Import and choose Upload Files.
- Choose Field Boundary as the Data Type and the appropriate template as the Format Type from the drop-down menus.
- When selecting the Data Type, a Supported File Types bar displays illustrating file types that may be imported for the chosen type of data.
- Browse to select a file(s) or drag and drop the file(s) in the designated area and choose Upload.
Note: When importing files, all three file types included with a shape file – .DBF, .SHX, and .SHP – must be selected. Alternatively, a zip file containing several shape files may also be selected. - Once the boundary file(s) are loaded and ready for import, highlight a file and select the Ellipsis icon in the Field Boundaries area. Choose Import Single File or highlight multiple files, select the Ellipsis icon, and choose Import Selected to batch import boundary files.
- Optionally select the Ellipsis icon for each Field and enter the information in the Edit Field Boundary window. This is only required if a Grower or Field is not present in the file or if changes need made.
Note: File names displaying in black text indicate no overlapping issues. File names displaying in yellow text indicate a Field with an overlapping boundary which will need corrected. File names displaying in red indicate an issue with a value that needs addressed prior to proceeding. - Choose Save. An error message displays if required fields are not completed.
- Select Add Field. The Field will be linked to the Agvance Hub as indicated by the checkmark in the Mapping column of the Field Selection window and is visible in the Customer Field list.
Note: If using a template, the customer information autofills from Agvance and will not require adding the Customer Name, Farm Name, and Field Name(s).
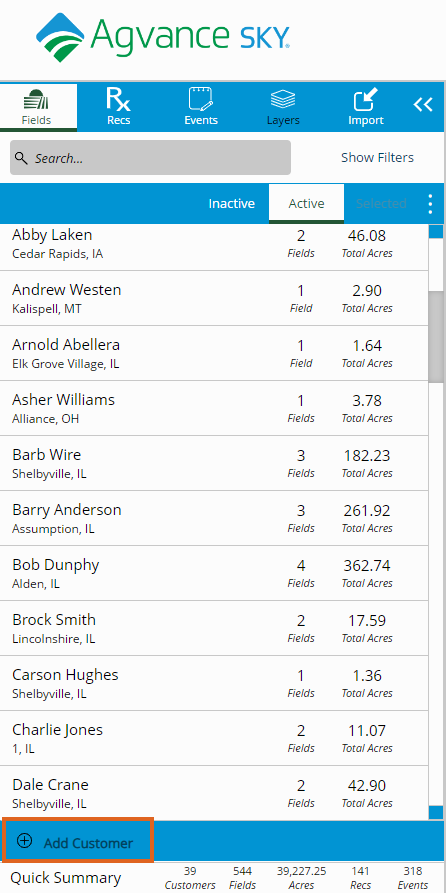
Adding New Customers
When adding a new Customer to SKY Mapping, the Customer must first reside in the Agvance Hub with an address. If the Customer being added to SKY Mapping does not exist in the Agvance Hub, they must be added there so they can be chosen from the populated Customer list in SKY Mapping.
- Select Add Customer at the bottom of the Customer list.
- Choose Add Location. Select the Location in Agvance where the customer to be added is located.
- Select Customer Name. Choose the Customer to be added from the drop-down. This list populates from the Customers in the Agvance Hub.
Note: The Customer's address automatically populates. Optionally select +Add Address if applicable. - Choose Save. The new customer populates in the Customer list.

Adding New Farms
- To add a Farm to a customer’s account, select the Ellipsis icon for that customer and choose Add New Field.
- Choose the Farm Name drop-down menu.
- If the customer does not have any Farms to choose in the list, type the Farm name in the space provided and select Save. The Field polygon and name are required. An error message displays if required fields are not completed. Once saved, the new Farm is added to the drop-down menu to use on future Fields.
Adding Field Imagery
Importing Imagery
- In Premium Mapping, select Import from the Action menu, and choose Upload Files.
- In the Data Type field, select Imagery.
- In the Format Type field, choose GeoTIFF (*.tiff, *.tif).
- Drag and drop image files or import by selecting Click Here To Browse To Files.
- After selecting the files, choose Upload.
- i displays when processing is complete.
- Select the uploaded file then choose the Vertical Ellipsis icon to the right of the file. Select Import Single File. The files are scanned and imported.
- Select the image name in the Imagery Detail field to Edit. Choose to update the Layer Name, Season, and Date, then select Save.
- The image matches to a Field boundary within Premium Mapping and displays on the screen. If a Field does not exist for the image, select Fields from the Menu bar to create one.
- Select Next to review details of the importing image and choose Next again to continue.
- Select Create Layer. Once created, Complete displays. Choose Close.
Working with Imagery
- From the Menu bar, select a Field.
- Within the Field, select Layers and choose the Field Data tab.
- Choose the Vertical Ellipsis icon to Edit Layer, Delete Layer, or Print Layer.
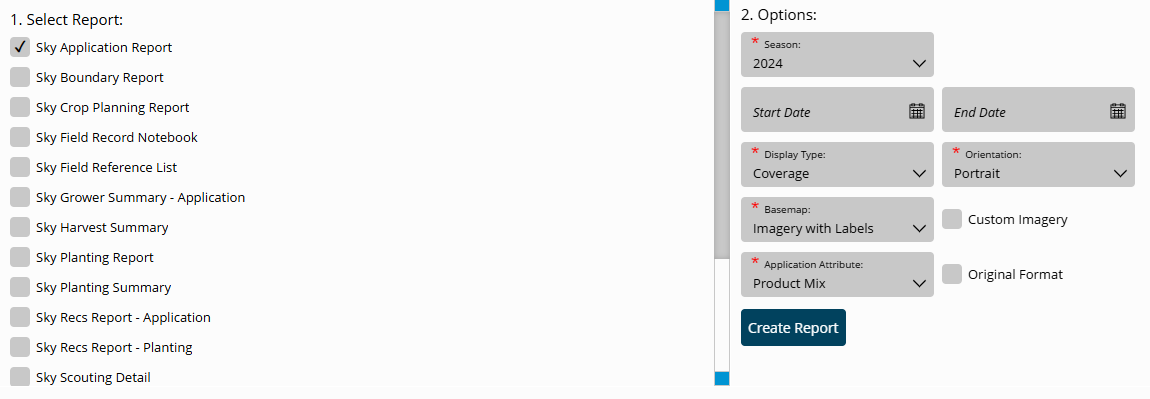
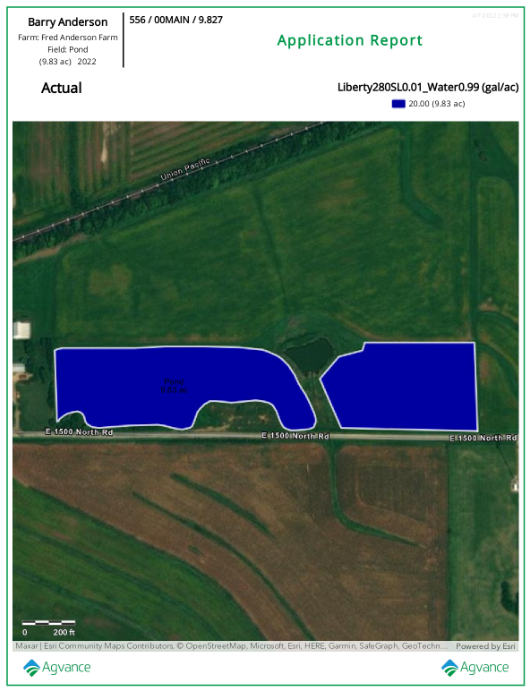
SKY Application Report
The SKY Application Report helps reconcile purchased product to applied product by displaying the actual product applied with minimum and maximum rates, along with visual comparisons for yield or soil test data.
- Navigate to Reports / SKY Mapping and select the option to run the Sky Application Report.
 Note: Individual Events under each Field can also be selected for this report. Selecting multiple Events for multiple Customers will cause the report to display per Grower.
 - Choose the appropriate season from the Season drop-down under Options. This runs all Application Events for the chosen Field(s) per season selected.
- Select the Display Type drop-down and choose from the following:
- Coverage – This displays results as a coverage type map.
- Point – This displays results based on point data.
- Polygon – Results display by polygon.
- Select the desired Basemap imagery from the Basemap drop-down menu.
- Once all desired report criteria is selected, choose Create Report.
- The report displays in the Reports Based on Field Selection grid with a status of In Progress. When the report has been generated, choose View Report to open the report.
 Note: With the report open, choose from multiple report tools on the left to Download, Print, or make additional markups/adjustments to the report.
 Note: Individual Events under each Field can also be selected for this report. Selecting multiple Events for multiple Customers will cause the report to display per Grower.
  Note: With the report open, choose from multiple report tools on the left to Download, Print, or make additional markups/adjustments to the report.
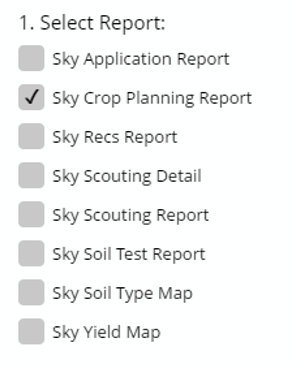
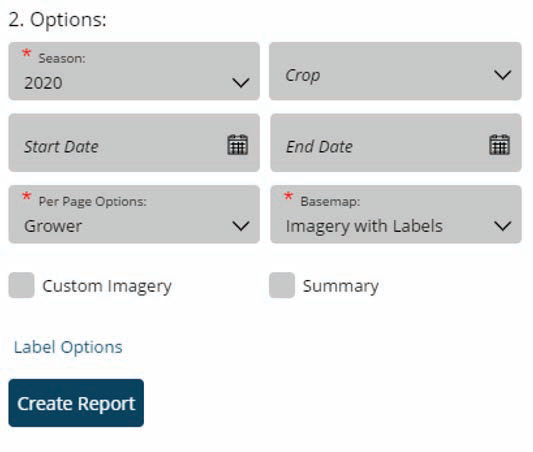
SKY Crop Planning Report
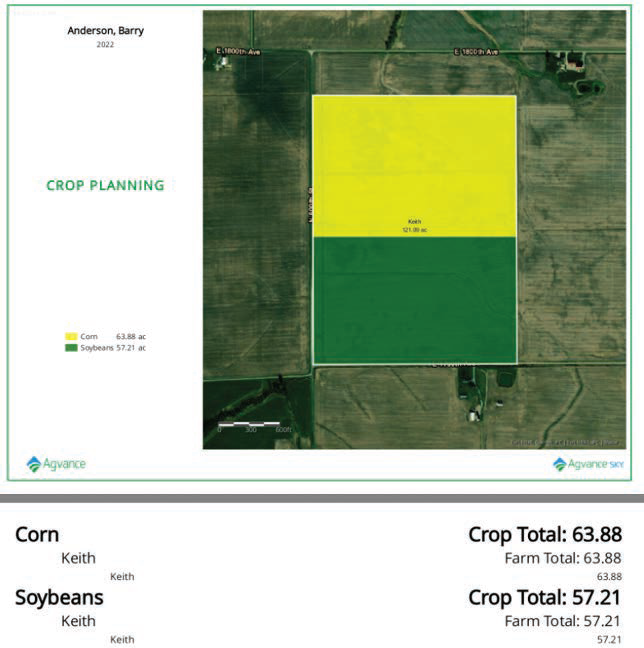
The Sky Crop Planning report displays total crop acres per Grower, Farm, or Field when a Planting Rec is created to assist Growers in crop planning.
- Navigate to Reports / SKY Mapping and select the Sky Crop Planning Report.
- Multiple Fields can be selected as well as individual Recs. The report will display per Grower, Farm, or Field.
- Choose the appropriate season from the Season drop-down under Options.
- From the Per Page Options drop-down, choose to view the report by Grower, Farm, or Field. Each Grower, Farm, or Field selected for the report will display on a new page.
- From the Basemap drop-down, select the desired Basemap imagery to display.
- Optionally select the following report criteria
- Crop – Choose to run the report for only the Crop selected on the chosen Field(s) or Rec(s).
- Start / End Date – Select to run the report for the selected Fields or Recs within a desired date range.
- Custom Imagery – Select if custom drone imagery has been imported for the chosen Field.
- Summary – Select to print a summary page designating specific crops with totals.
- Choose Label Options to select which labels to display on each Field included in the report.
- Once all desired report criteria are selected, choose Create Report.
- The report displays in the Reports Based on Field Selection grid with a Status of In Progress. Choose View Report to open the report.


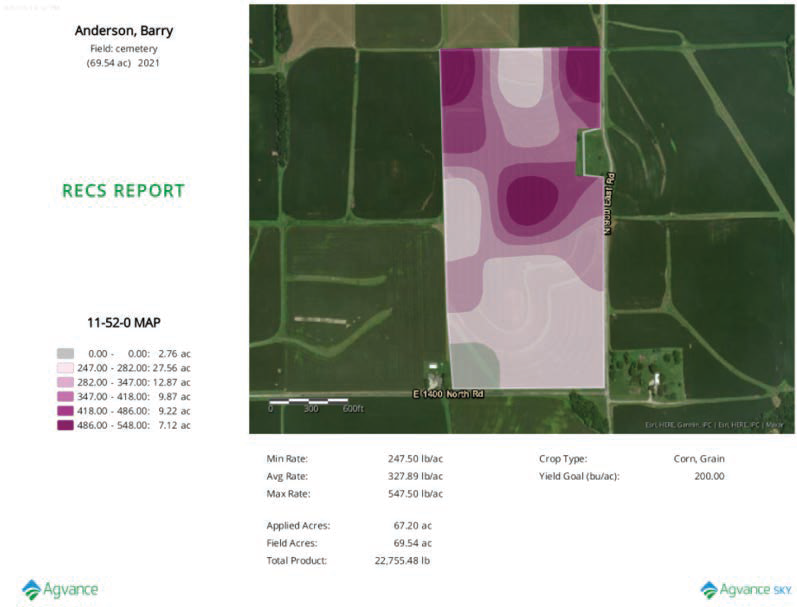
SKY Recs Report
The Sky Recs Report provides Growers an overview of fertilizer or planting plans with rates, total product used, and associated application costs.
- Navigate to Reports / SKY Mapping and select the Sky Soil Type Map Report.
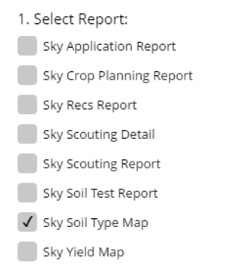
- Select the desired Field(s).
Note: Multiple Fields can be selected and will display on a single report. To print one Field per page, select a single Field. - Choose the appropriate season from the Season drop-down under Options.
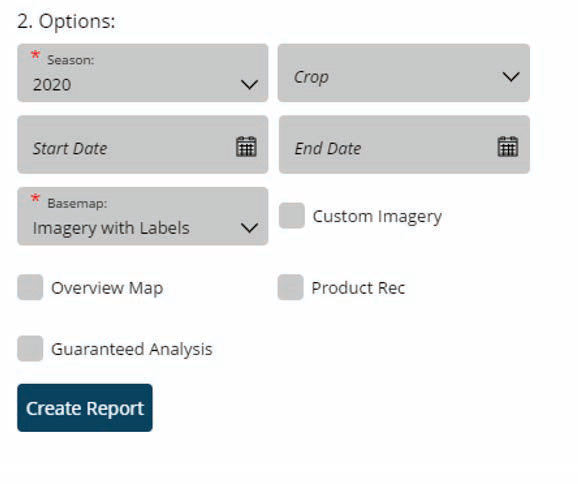
- Select the desired Basemap imagery from the Basemap drop-down.
- Optionally select the following report criteria:
- Start / End Date – Choose to include only Recs within the selected date range.
- Custom Imagery – Select if custom drone imagery has been imported for the chosen Field.
- Overview Map – Select to add a boundary overview of the field to the report.
- Once all desired report criteria are selected, choose Create Report.
Note: If no Recs are available per the report criteria selected, a warning message displays and the report fails to run. - The report displays in the Reports Based on Field Selection grid with a Status of In Progress. Choose View Report to open the report.


SKY Scouting Detail Report
The Sky Scouting Detail report displays a recap and details of Scouting Events per Field to help keep Growers informed of Field events throughout the season.
- Navigate to Reports / SKY Mapping and select the Sky Scouting Detail Report.
- Select the desired Field(s).
Note: Individual Events under each Field can also be selected. Choosing multiple Events causes the report to display per Field. - Choose the appropriate season from the Season drop-down under Options. This runs all Recs for the chosen Field(s) per season selected.
- Select the desired Basemap imagery from the Basemap dropdown.
- Optionally select the following report criteria:
- Crop – Select to run the report for only the Crop selected on the chosen Field(s).
- Start / End Date – Choose to include only Recs within the selected date range.
- Custom Imagery – Select if custom drone imagery has been imported for the chosen Field.
- Once all desired report criteria are selected, choose Create Report.
Note: If no Events are available per the report criteria selected, a warning message displays and the report fails to run. - The report displays in the Reports Based on Field Selection grid with a Status of In Progress. Choose View Report to open the report.
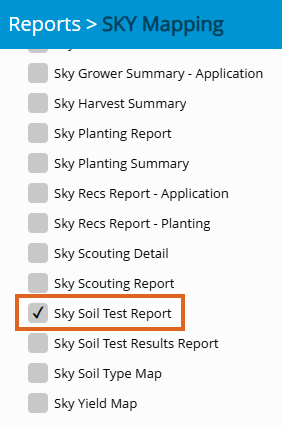
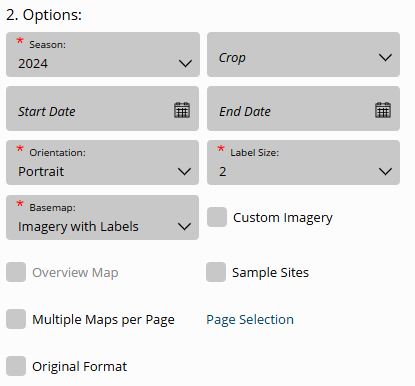
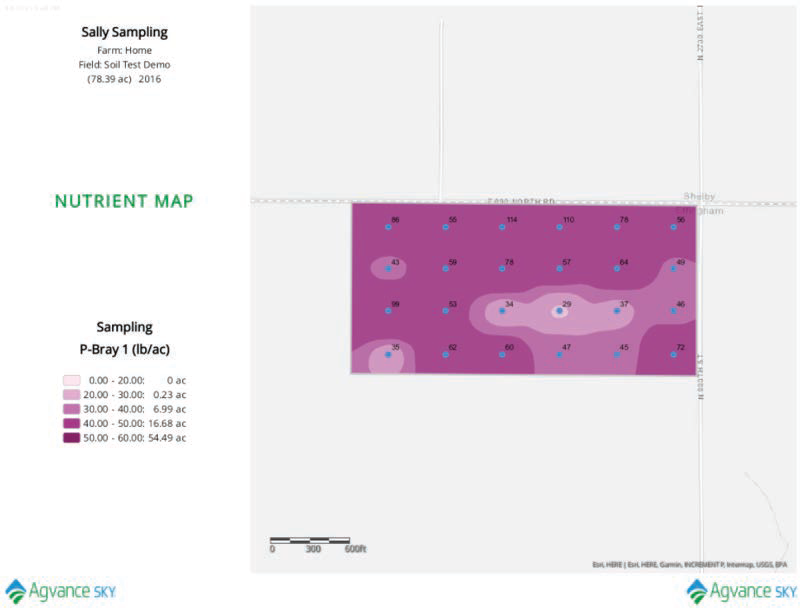
SKY Soil Test Report
The Sky Soil Test Report displays soil test results by point including a surface layer. The surface view can be updated in the Layers tab of SKY Mapping to reflect different legend values or color ramps.
- Navigate to Reports / SKY Mapping and select the Sky Soil Test Report.
- Select the desired Field(s).
Note: Individual Events under each Field can also be selected. When multiple Events are selected, they will display per Field. - Choose the appropriate season from the Season drop-down under Options.
- Select the desired Basemap imagery from the Basemap drop-down.
- Optionally select the following report criteria:
- Crop – Select to run the report for only the Crop selected on the chosen Field(s).
- Start / End Date – Choose to include only Recs within the selected date range.
- Custom Imagery – Select if custom drone imagery has been imported for the chosen Field.
- Sample Sites – Choose to display sample sites along with the surface.
- Overview Map – Select to add a boundary overview of the Field(s) to the report.
- Page Selection – Choose specific nutrients to display per page.
- Once all desired report criteria are selected, choose Create Report.
Note: If no Events are available per the report criteria selected, a warning message displays, and the report fails to run. - The report displays in the Reports Based on Field Selection grid with a Status of In Progress. Choose View Report to open the report.


SKY Soil Type Map Report
The Sky Soil Type Map report displays the soil type map for the selected Field.
- Navigate to Reports / SKY Mapping and select the Sky Soil Type Map Report.
- Select the desired Field(s).
Note: Multiple Fields can be selected and will display on a single report. To print one Field per page, select a single Field. - Choose the appropriate season from the Season drop-down under Options.
- Select the desired Basemap imagery from the Basemap drop-down.
- Optionally select the following report criteria:
- Start / End Date – Choose to include only Recs within the selected date range.
- Custom Imagery – Select if custom drone imagery has been imported for the chosen Field.
- Overview Map – Select to add a boundary overview of the field to the report.
- Once all desired report criteria are selected, choose Create Report.
Note: If no Recs are available per the report criteria selected, a warning message displays and the report fails to run. - The report displays in the Reports Based on Field Selection grid with a Status of In Progress. Choose View Report to open the report.
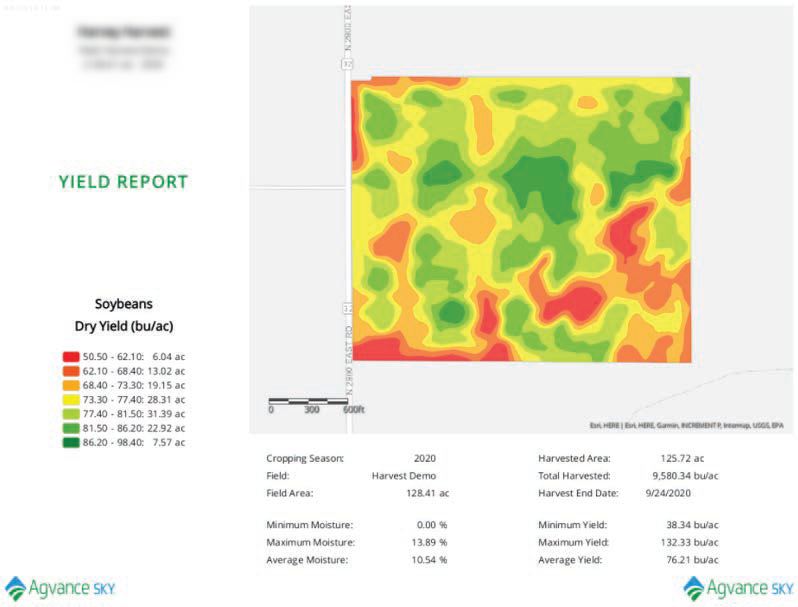
SKY Yield Map Report
The Sky Yield Map report displays the harvested yield monitor data and field stats to create a visualization of data collected throughout the harvesting season.
- Navigate to Reports / SKY Mapping and select the Sky Yield Map report. Choose the appropriate season from the Season drop-down under Options.
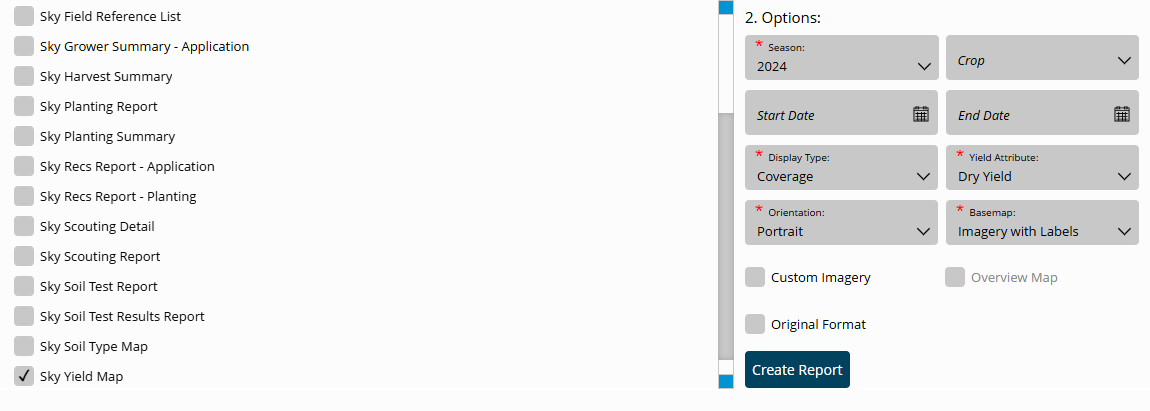
- Select the desired Basemap imagery from the Basemap drop-down. Optionally select the following report criteria:
- Crop – Select to run the report for only the Crop selected on the chosen Field(s).
- Start / End Date – Choose to include only Recs within the selected date range.
- Custom Imagery – Select if custom drone imagery has been imported for the chosen Field.
- Overview Map – Select to add a boundary overview of the field to the report.
- Select the desired Field(s).
Note: Multiple Fields and Events can be selected. If selecting multiple Events, the Events will display per Field on the report. - Once all desired report criteria are selected, choose Create Report.
Note: If no Recs are available per the report criteria selected, a warning message displays and the report fails to run. - The report displays in the Reports Based on Field Selection grid with a Status of In Progress. Choose View Report to open the report.
- The report prints in Polygon format with statistics based on filters set up on the selected Event(s).